      [,1]  [,2]
[1,]  50.3 -49.7
[2,] -49.7 50.3Ridge Regression and Cross Validation
MSSC 6250 Statistical Machine Learning
Department of Mathematical and Statistical Sciences
Marquette University
Ridge Regression
When Ordinary Least Squares (OLS) Doesn’t Work Well: Collinearity
- When predictors are highly correlated, \(\mathrm{Var}(b_j)\) is much inflated.1
- A tiny change in the training data causes a large change in \(b_j\), leading to unreliable estimation and prediction.
\({\bf X'X} = \begin{bmatrix} 1 & 0.99 \\ 0.99 & 1 \end{bmatrix}\) \(\quad ({\bf X'X})^{-1} = \begin{bmatrix} 50.3 & -49.7 \\ -49.7 & 50.3 \end{bmatrix}\)
-
\(\mathrm{Var}(b_j) = 50.3\sigma^2\)
- An increase in 50-fold over the ideal case when the two regressors are orthogonal.
When OLS Doesn’t Work Well: Optimization Perspective
\(\beta_1 = \beta_2 = 1\) and \(\mathrm{Corr}(x_1, x_2) = 0.99\)
The relatively “flat” valley in the objective function walks along the eigen-vector of \({\bf X}'{\bf X}\) having the smallest eigen-value.
When OLS Doesn’t Work Well: Optimization Perspective
- A little change in the training set perturbs the objective function. The LSEs lie on a valley centered around the truth.

When OLS Doesn’t Work Well: High Variance
The optimizer could land anywhere along the valley, leading to large variance of the LSE.
Over many simulation runs, the LSE lies around the line of \(\beta_1 + \beta_2 = 2\), the direction of the eigen-vector of the smallest eigen-value.


When OLS Doesn’t Work Well: Large-\(p\)-small-\(n\) (High Dimensional Data)
OLS stays well in the world of “large-\(n\)-small-\(p\)”.
When \(p > n\), \({\bf X}'{\bf X}\) is not invertible.
There is no unique \(\boldsymbol \beta\) estimate.
Intuition: Too many degrees of freedom (\(p\)) to specify a model, but not enough information (\(n\)) to decide which one is the one.
- Too flexible and ends up with overfitting
Remedy for Large Variance and Large-\(p\)-small-\(n\)
Make \({\bf X}'{\bf X}\) invertible when \(p > n\) by regularizing coefficient behavior!
A good estimator balances bias and variance well, or minimizes the mean square error \[\text{MSE}(\hat{\beta}) = E[(\hat{\beta} - \beta)^2] = \mathrm{Var}(\hat{\beta}) + \text{Bias}(\hat{\beta})^2\]
Find a biased estimator \(\hat{\boldsymbol \beta}\) that has smaller variance and MSE than the LSE \({\bf b}\).


Ridge Regression
- Idea: Add a ridge (diagonal matrix) to \({\bf X} ' {\bf X}\).1
\[\widehat{\boldsymbol \beta}^\text{r} = (\mathbf{X}' \mathbf{X}+ n \lambda \mathbf{I})^{-1} \mathbf{X}' \mathbf{y},\]
- To regularize coefficient behavior, we add an \(\ell_2\) penalty to the residual sum of squares, for some tuning parameter \(\lambda > 0\).
\[ \begin{align} \widehat{\boldsymbol \beta}^\text{r} =& \, \mathop{\mathrm{arg\,min}}_{\boldsymbol \beta} \underbrace{\lVert \mathbf{y}- \mathbf{X}\boldsymbol \beta\rVert_2^2}_{SS_{res}} + n \lambda \lVert\boldsymbol \beta\rVert_2^2\\ =& \, \mathop{\mathrm{arg\,min}}_{\boldsymbol \beta} \underbrace{\frac{1}{n} \sum_{i=1}^n (y_i - x_i'\boldsymbol \beta)^2}_{\text{MSE}_{\texttt{Tr}}} + \lambda \sum_{j=1}^p \beta_j^2\\ =& \, \mathop{\mathrm{arg\,min}}_{\boldsymbol \beta} \color{green} - \text{ goodness of fit } + \text{ model complexity/flexibility} \end{align} \]
Properties of Ridge Regression
\[ \begin{align} \widehat{\boldsymbol \beta}^\text{r} =& \mathop{\mathrm{arg\,min}}_{\boldsymbol \beta} \frac{1}{n} \sum_{i=1}^n (y_i - x_i'\boldsymbol \beta)^2 + \lambda \sum_{j=1}^p \beta_j^2, \end{align} \]
Properties of ridge regression:
- Has less degrees of freedom in the sense that the cost increases when large coefficients are used.
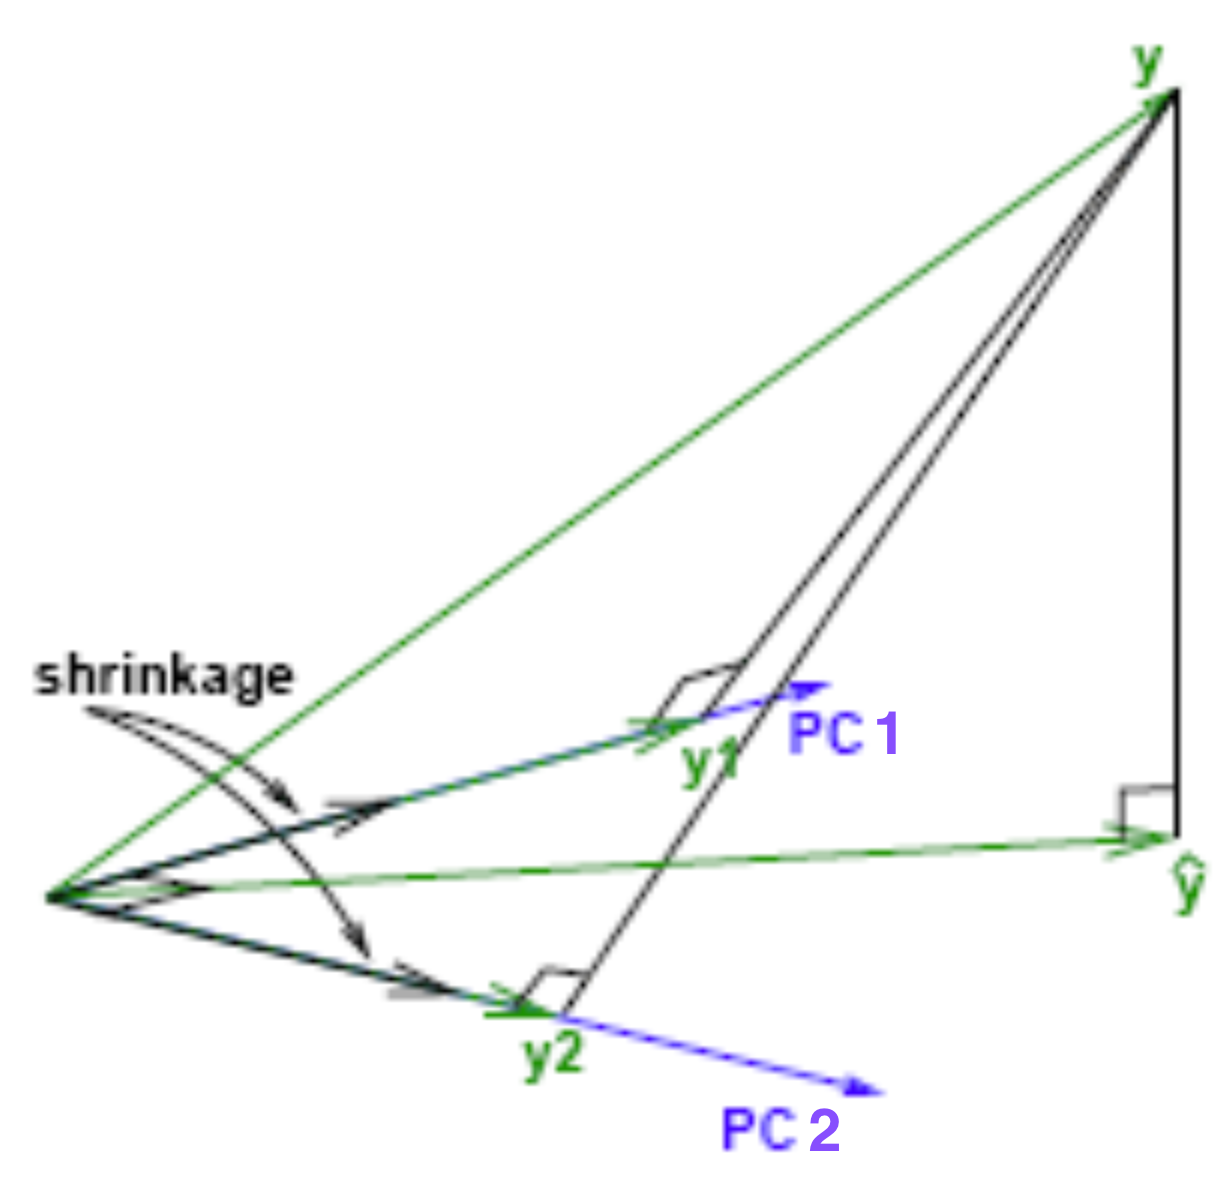
- Favors small-magnitude coefficient estimates to avoid cost penalty. (Shrinkage)
- The shrinkage parameter \(\lambda\) controls the degree of penalty.
- \(\lambda \rightarrow 0\): No penalty, and \(\widehat{\boldsymbol \beta}^\text{r} = \bf b\).
- \(\lambda \rightarrow \infty\): Unbearable penalty, and \(\widehat{\boldsymbol \beta}^\text{r} \rightarrow \mathbf{0}\)
Ridge Penalty
\[\lambda \lVert \boldsymbol \beta\rVert^2_2 = \lambda \boldsymbol \beta' \mathbf{I}\boldsymbol \beta\]
The penalty contour is circle-shaped
Force the objective function to be more convex
A more stable or less varying solution

Geometrical Meaning of Ridge Regression

More Convex Loss Function
- Adding a ridge penalty forces the objective to be more convex due to the added eigenvalues.

The Bias-variance Tradeoff
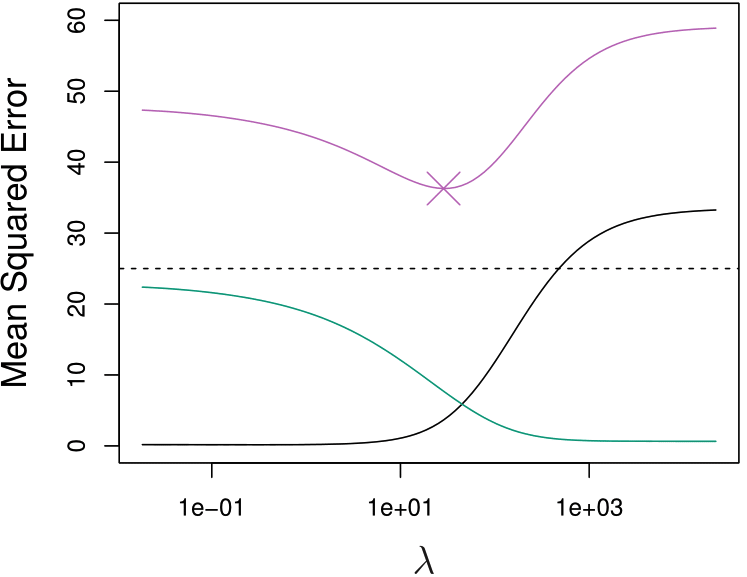
- As \(\lambda \downarrow\), bias \(\downarrow\) and variance \(\uparrow\)
- As \(\lambda \uparrow\), bias \(\uparrow\) and variance \(\downarrow\)

Lower Test MSE
When \(b_j\) are variable or \(p > n\), ridge regression could have lower test MSE and better predictive performance.
Squared bias (black)
Variance (green)
\(\text{MSE}_{\texttt{Tr}}\) (purple)

MASS::lm.ridge()
The
lambdaparameterlm.ridge()actually specifies the \(n\lambda\) in our notation.OLS is scale equivalent: \(X_jb_j\) remains the same regardless of how \(X_j\) is scaled.
Ridge coefficient estimates can change substantially when multiplying a given predictor by a constant. \(X_j\hat{\beta}^{r}_{j, \lambda}\) depends on \(\lambda\), the scaling of \(X_j\), and even the scaling of other predictors.
Standardize all predictors!1
               mpg cyl disp  hp drat   wt qsec vs am gear carb
Mazda RX4     21.0   6  160 110 3.90 2.62 16.5  0  1    4    4
Mazda RX4 Wag 21.0   6  160 110 3.90 2.88 17.0  0  1    4    4
Datsun 710 22.8 4 108 93 3.85 2.32 18.6 1 1 4 1 cyl disp hp drat wt qsec vs
16.53766 -0.16240 0.00233 -0.01493 0.92463 -2.46115 0.49259 0.37465
am gear carb
2.30838 0.68572 -0.57579 Scaling Issues of lm.ridge()
coef(fit)transforms these back to the original scale.fit$coefshows the coefficients of the standardized predictors.
Scaling Issues of lm.ridge()
   cyl   disp     hp   drat     wt   qsec     vs     am   gear   carb
-0.285 0.285 -1.008 0.487 -2.370 0.866 0.186 1.134 0.498 -0.915 -
lm.ridge()uses \(n\) instead of \(n-1\) when calculating the standard deviation.
Scaling Issues of lm.ridge()
   cyl   disp     hp   drat     wt   qsec     vs     am   gear   carb
-0.285 0.285 -1.008 0.487 -2.370 0.866 0.186 1.134 0.498 -0.915 cyl disp hp drat wt qsec vs am gear carb
[1,] -0.285 0.285 -1.01 0.487 -2.37 0.866 0.186 1.13 0.498 -0.915Ridge Trace

- Select a value of \(\lambda\) at which the ridge estimates are stable.
Methods for Choosing \(\lambda\)
modified HKB estimator is 2.59
modified L-W estimator is 1.84
smallest value of GCV  at 15
Hoerl, Kennard, and Baldwin (1975): \(\lambda \approx \frac{p \hat{\sigma}^2}{{\bf b}'{\bf b}}\)
Lawless and Wang (1976): \(\lambda \approx \frac{np \hat{\sigma}^2}{{\bf b'X}'{\bf Xb}}\)
Golub, Health, and Wahba (1979): Generalized Cross Validation
Cross Validation
Cross Validation (CV) is a resampling method.
Resampling methods refit a model of interest to data sampled from the training set.
-
CV can be used to
- estimate the test error when there is no test data. (Model assessment)
- select the tuning parameters that controls the model complexity/flexibility. (Model selection)
\(k\)-Fold Cross Validation
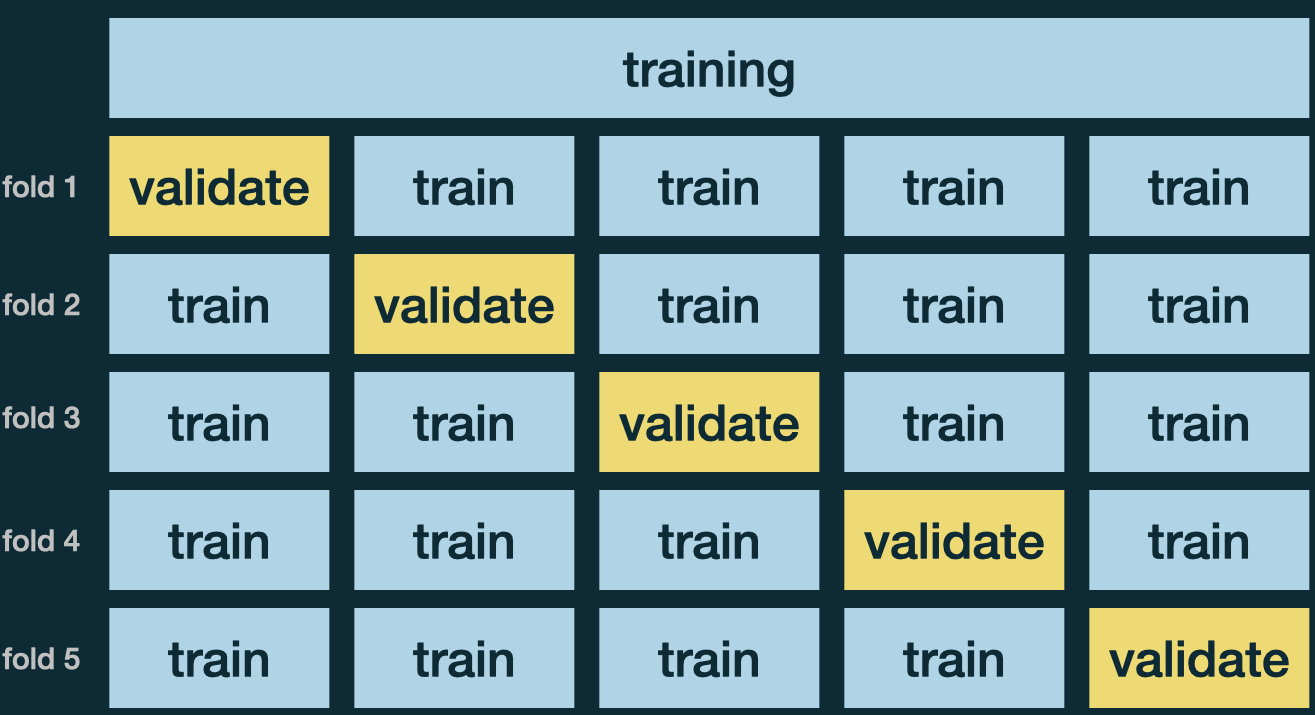
Randomly divide the training data into \(k\) folds, of approximately equal size.
Use 1 fold for validation to compute MSE, and the remaining \(k - 1\) partitions for training.
Repeat \(k\) times. Each time a different fold is treated as a validation set.
Average \(k\) metrics, \(\text{MSE}_{CV} = \frac{1}{k}\sum_{i=1}^k\text{MSE}_i\).
Use the CV estimate \(\text{MSE}_{CV}\) to select the “best” tuning parameter.

glmnet package ![]()
The parameter
alphacontrols the ridge (alpha = 0) and lasso (alpha = 1) penalties.Supply a decreasing sequence of
lambdavalues.lm.ridge()use \(SS_{res}\) and \(n\lambda\), whileglmnet()use \(\text{MSE}_{\texttt{Tr}}\) and \(\lambda\).Argument
xshould be a matrix.
Note
-
lm.ridge()andglmnet()coefficients do not match exactly, specially when transforming back to original scale. - No need to worry too much as we focus on predictive performance.


\(k\)-Fold Cross Validation using cv.glmnet()1
- The \(\lambda\) values are automatically selected, on the \(\log_{e}\) scale.
Determine \(\lambda\)
[1] 2.75[1] 16.111 x 1 sparse Matrix of class "dgCMatrix"
s1
(Intercept) 21.11734
cyl -0.37134
disp -0.00525
hp -0.01161
drat 1.05477
wt -1.23420
qsec 0.16245
vs 0.77196
am 1.62381
gear 0.54417
carb -0.54742Generalized Cross-Validation
The generalized cross-validation (GCV) is a modified version of the leave-one-out CV (\(n\)-fold CV).
The GCV criterion is given by \[\text{GCV}(\lambda) = \frac{1}{n}\sum_{i=1}^n \left[ \frac{y_i - x_i' \widehat{\boldsymbol \beta}^\text{r}_\lambda}{1 - \frac{\text{Trace}(\mathbf{S}_\lambda)}{n}} \right]^2\]
where \(\mathbf{S}_\lambda\) is the hat matrix corresponding to the ridge regression:
\[\mathbf{S}_\lambda = \mathbf{X}(\mathbf{X}' \mathbf{X}+ n\lambda \mathbf{I})^{-1} \mathbf{X}'\]
Generalized Cross-Validation
Select the best \(\lambda\) that produces the smallest GCV.


