Bayesian Linear Regression
MSSC 6250 Statistical Machine Learning
Department of Mathematical and Statistical Sciences
Marquette University
Bayesian Inference
Thinking like a Bayesian
-
When flipping a fair coin, we say that “the probability of flipping Heads is 0.5.” How do you interpret this probability?
- If I flip this coin over and over, roughly 50% will be Heads.
- Heads and Tails are equally plausible.
- Both a. and b. make sense.
-
An election is coming up and a pollster claims that candidate Yu has a 0.9 probability of winning. How do you interpret this probability?
- If we observe the election over and over, candidate Yu will win roughly 90% of the time.
- Candidate Yu is much more likely to win than to lose.
- The pollster’s calculation is wrong. Candidate Yu will either win or lose, thus their probability of winning can only be 0 or 1.
- 1. a = 1 pt, b = 3 pts, c = 2 pts
- 2. a = 1 pt, b = 3 pts, c = 1 pt
Thinking like a Bayesian
-
Two claims.
(1) Ben claims he can predict the coin flip outcome. To test his claim, you flip a fair coin 8 times and he correctly predicts all.
(2) Emma claims she can distinguish natural and artificial sweeteners. To test her claim, you give her 8 samples and she correctly identifies each.
In light of these experiments, what do you conclude?
- You’re more confident in Emma’s claim than Ben’s claim.
- The evidence supporting Ben’s claim is just as strong as the evidence supporting Emma’s claim.
-
Suppose that during a doctor’s visit, you tested positive for COVID. If you only get to ask the doctor one question, which would it be?
- What’s the chance that I actually have COVID?
- If in fact I don’t have COVID, what’s the chance that I would’ve gotten this positive test result?
- 3. a = 3 pts, b = 1 pt
- 4. a = 3 pts, b = 1 pt
Frequentist or Bayesian?
- Totals 4-5: your thinking is frequentist
- Totals 9-12: your thinking is Bayesian
- Totals 6-8: you see strengths in both philosophies
The Meaning of Probability: Relative Frequency
- The frequentist interprets probability as the long-run relative frequency of a repeatable experiment.
The probability that some outcome of a process will be obtained is defined as
the relative frequency with which that outcome would be obtained if the process were repeated a large number of times independently under similar conditions.
      Frequency Relative Frequency
Heads         4                0.4
Tails         6                0.6
Total        10                1.0
---------------------
      Frequency Relative Frequency
Heads       512              0.512
Tails       488              0.488
Total      1000              1.000
---------------------- If we repeat tossing the coin 10 times, the probability of obtaining heads is 40%.
- If 1000 times, the probability is 51.2%.

Issues of Relative Frequency
- 😕 How large of a number is large enough?
- 😕 Meaning of “under similar conditions”
- 😕 The relative frequency is reliable under identical conditions?
- 👉 We only obtain an approximation instead of exact value.
- 😂 How do you compute the probability that Chicago Cubs wins the World Series next year?

The Meaning of Probability: Relative Plausibility
- In the Bayesian philosophy, a probability measures the relative plausibility of an event.
- For the statement “candidate A has a 0.9 probability of winning”
- A frequentist might
- say the conclusion is wrong
- weirdly say in long-run hypothetical repetitions of the election, candidate A would win roughly 90% of the time.
- A Bayesian would say based on analysis the candidate A is 9 times more likely to win than to lose.
- A frequentist might
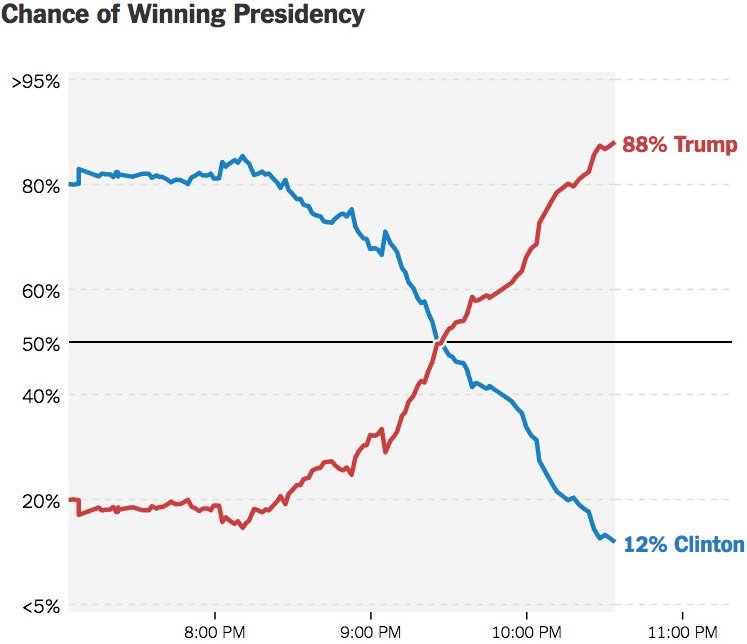
Everybody Changes Their Mind
How can we live if we don’t change? - Beyoncé. Lyric from “Satellites.”
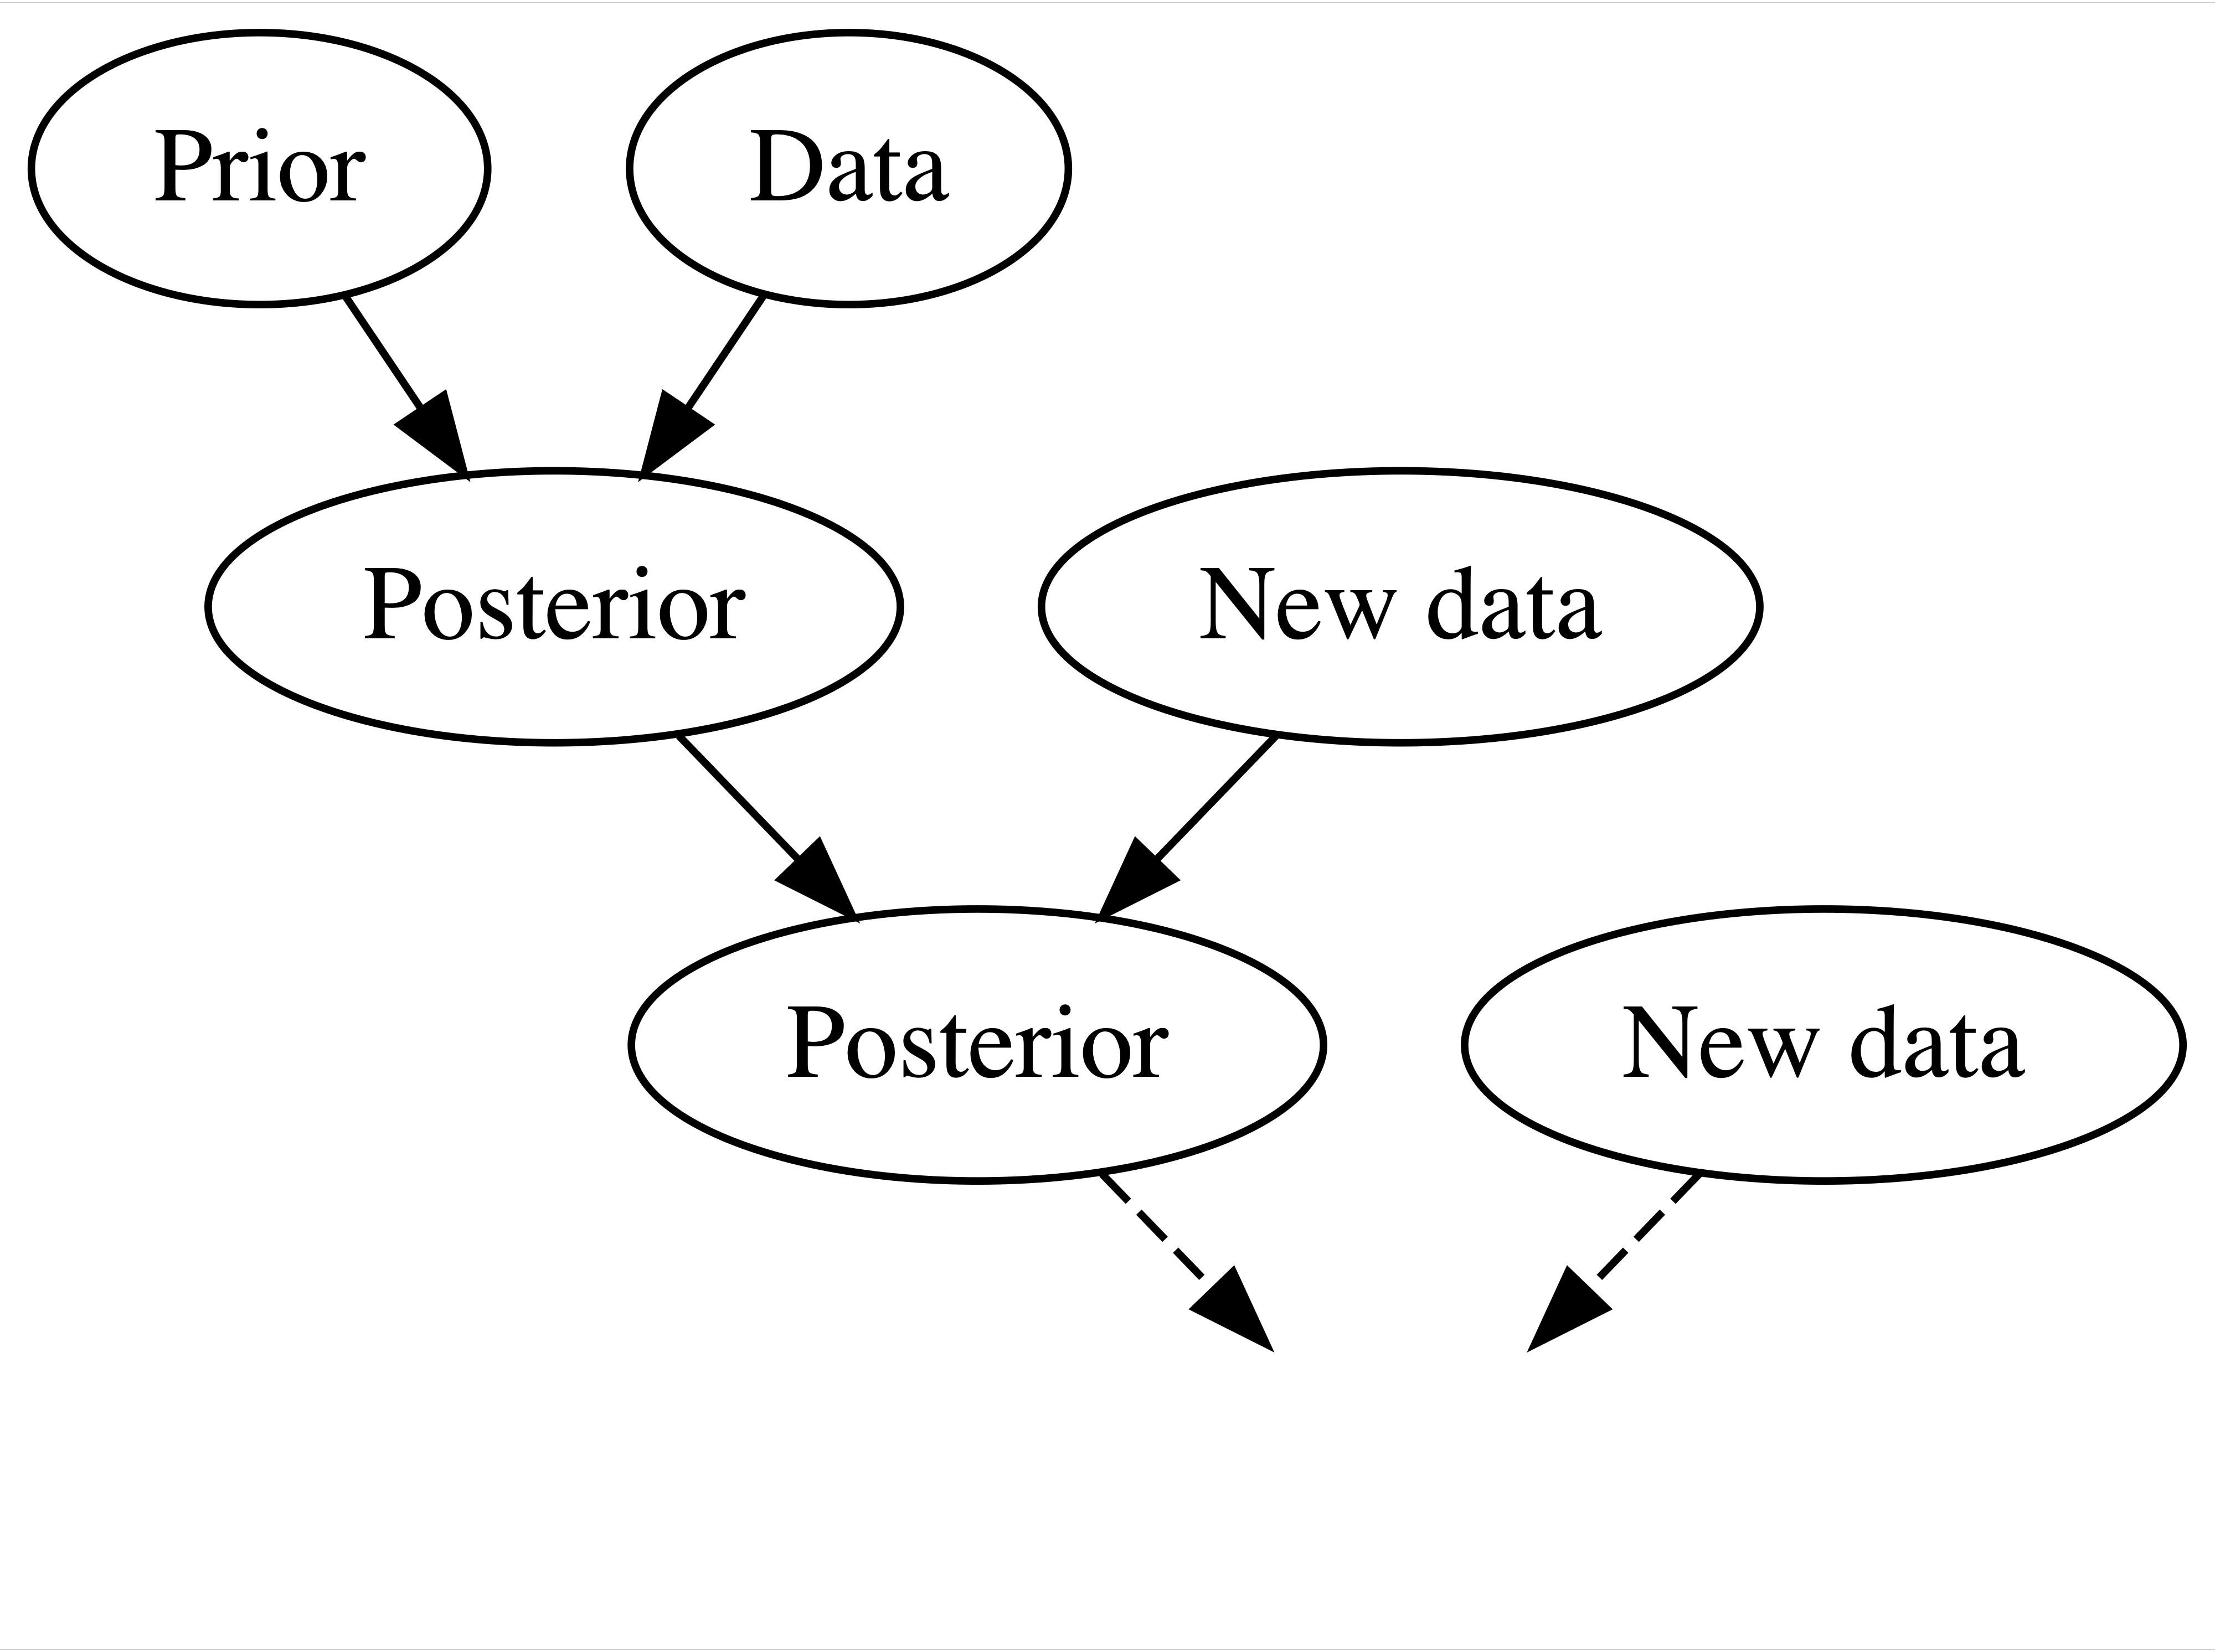
Using data and prior beliefs to update our knowledge (posterior), and repeating.
We continuously update our knowledge about the world as we accumulate lived experiences, or collect data.
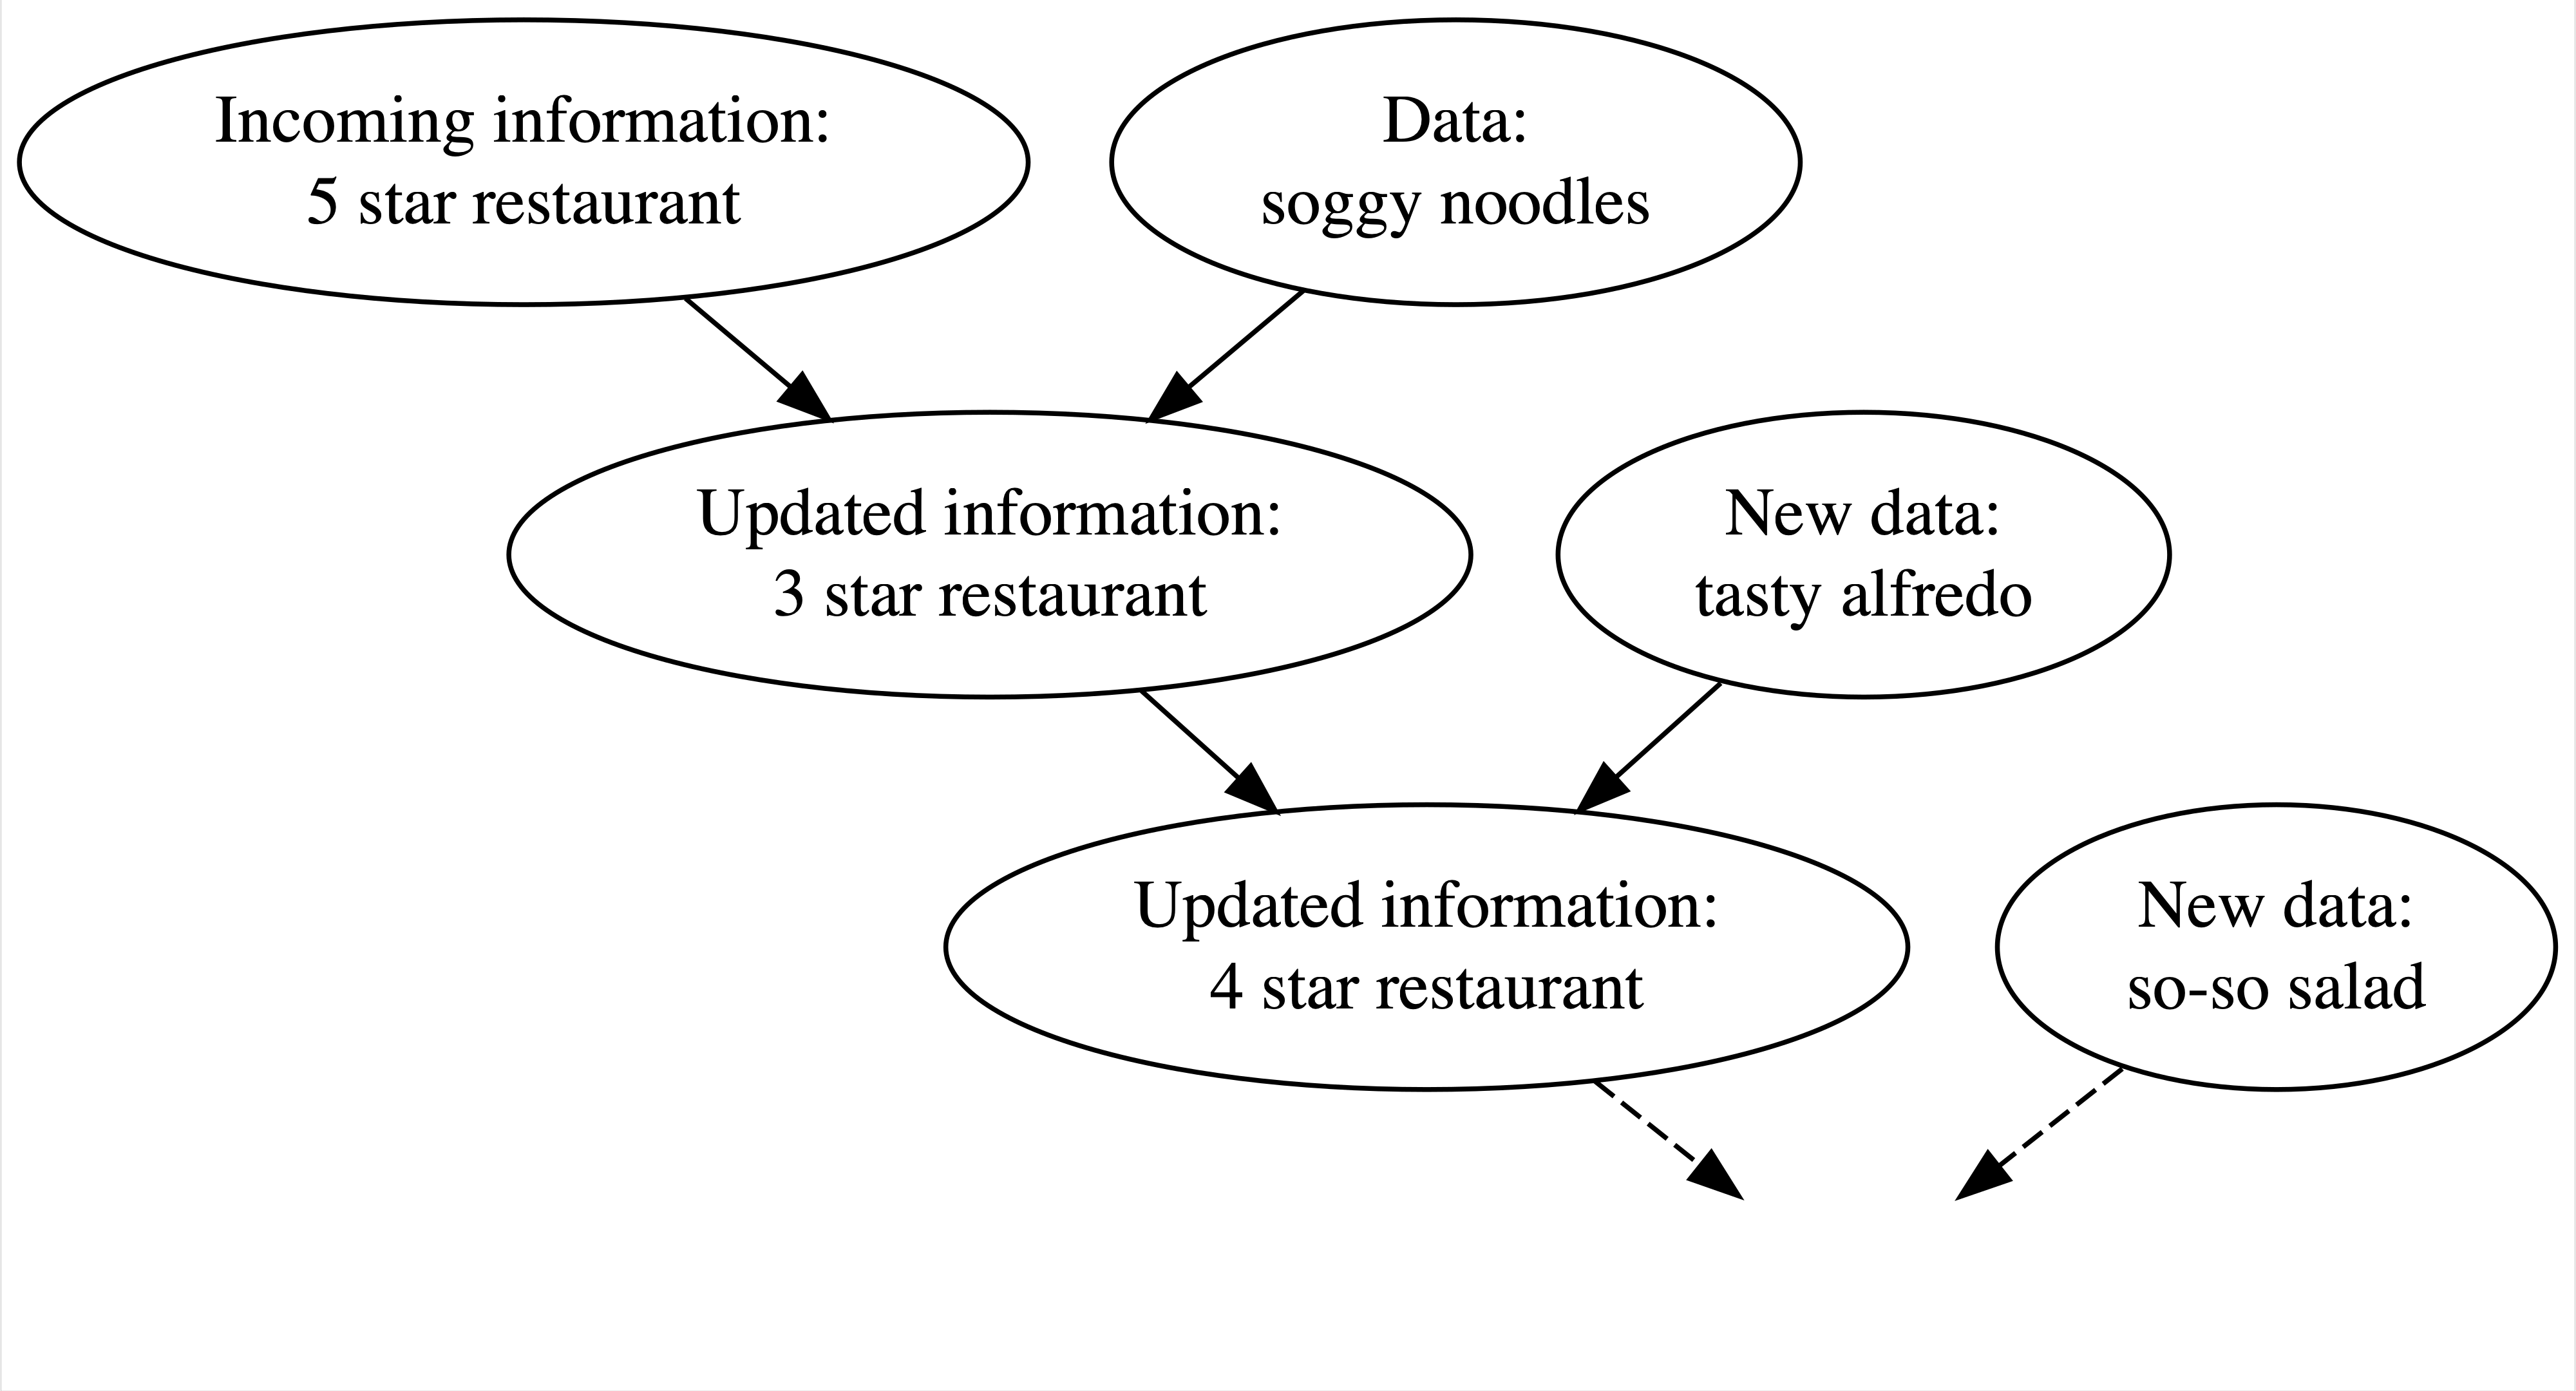
Fig 1.1 of https://www.bayesrulesbook.com/. The figures not being sourced come from this book too.
Bayesian Knowledge-building Process
Frequentist Relys on (Limited) Data Only
- In Question 3, in a frequentist analysis, “8 out of 8” is “8 out of 8” no matter if it’s in the context of Ben’s coins or Emma’s sweeteners.
- Equally confident conclusions that Ben can predict coin flips and Emma can distinguish between natural and artificial sweeteners.

- But do you really believe Ben’s claim 100%? 🤔 😕
- In fact, we judge their claim before evidence are collected, don’t we? 🤔
- You probably think Ben overstates his ability but Emma’s claim sounds relatively reasonable, right?
The Bayesian Balancing
- Frequentist throws out all prior knowledge in favor of a mere 8 data points.
- Bayesian analyses balance and weight our prior experience/knowledge/belief and new data/evidence to judge a claim or make a conclusion.

- We are not stubborn! If Ben had correctly predicted the outcome of 1 million coin flips, the strength of this data would far surpass that of our prior judgement, leading to a posterior conclusion that perhaps Ben is psychic!

Asking Different Questions
In Question 4,
- Bayesians answer (a) what’s the chance that I actually have COVID?
- Frequentists answer (b) if in fact I do not have COVID, what’s the chance that I would’ve gotten this positive test result?

| Test Positive | Test Negative | Total | |
|---|---|---|---|
| COVID | 3 | 1 | 4 |
| No COVID | 9 | 87 | 96 |
| Total | 12 | 88 | 100 |
\(H_0\): Do not have COVID vs. \(H_1\): Have COVID
A frequestist assesses the uncertainty of the observed data in light of an assumed hypothesis \(P(Data \mid H_0) = 9/96\)
A Bayesian assesses the uncertainty of the hypothesis in light of the observed data \(P(H_0 \mid Data) = 9/12\)
Fake News
- Tell if an incoming article is fake.
- Prior info: 40% of the articles are fake
  type   n percent
  fake  60     0.4
  real  90     0.6
 Total 150     1.0
-
Data come in: Check several fake and real articles, and found
!is more consistent with fake news.
 title_has_excl fake real
          FALSE   44   88
           TRUE   16    2
Total 60 90Bayesian Updating Rule

\(F\): an article is fake.
The prior probability model
| Event | \(F\) | \(F^c\) | Total |
|---|---|---|---|
| Probability \(P(\cdot)\) | 0.4 | 0.6 | 1 |
Bayesian Model for Events

 title_has_excl fake real
          FALSE   44   88
           TRUE   16    2
Total 60 90\(D\): an article title has exclamation mark.
Conditional probability: \(P(D \mid F) = 16/60 = 0.27\); \(P(D \mid F^c) = 2/90 = 0.02\).
-
Opposite position:
- Know the incoming article used
!(observed data) - Don’t know whether or not the article is fake (what we want to decide).
- Know the incoming article used
- Compare \(P(D \mid F)\) and \(P(D \mid F^c)\) to ascertain the relative likelihoods of observed data \(D\) under different scenarios of the uncertain article status.
Likelihood Function
- Likelihood function \(L(\cdot\mid D)\):
\[L(F \mid D) = P(D \mid F) \text{ and } L(F^c \mid D) = P(D \mid F^c)\]
- When \(F\) is known, the conditional probability function \(P(\cdot \mid F)\) compares the probabilities of an unknown event \(D\), \(D^c\), occurring with \(F\): \[P(D \mid F) \text{ vs. } P(D^c \mid F)\]
- When \(D\) is known, the likelihood function \(L(\cdot \mid D) = P(D \mid \cdot)\) evaluates the relative compatibility of data \(D\) with \(F\) or \(F^c\): \[L(F \mid D) \text{ vs. } L(F^c \mid D)\]
| Event | \(F\) | \(F^c\) | Total |
|---|---|---|---|
| Probability \(P(\cdot)\) | 0.4 | 0.6 | 1 |
| Likelihood \(L(\cdot \mid D)\) | 0.27 | 0.02 | 0.29 |
- The likelihood function is not a probability function!
Bayes’ Rule
\[\begin{align*} P(F \mid D) &= \frac{P(F \cap D)}{P(D)}\\ &= \frac{L(F \mid D)P(F)}{P(D)}\end{align*}\]
\[\text{posterior = } \frac{\text{likelihood} \cdot \text{prior }}{ \text{normalizing constant}} \]
- The normalizing constant \(P(D)\) is known as marginal likelihood or evidence.
Posterior
- Started with a prior understanding that there’s a 40% chance that the incoming article would be fake.
- Yet upon observing the use of an exclamation point in the title
“The president has a funny secret!”
a feature that’s more common to fake news.
- Our posterior understanding evolved quite a bit – the chance that the article is fake jumped to 89%.
| Event | \(F\) | \(F^c\) | Total |
|---|---|---|---|
| Prior prob \(P(\cdot)\) | 0.4 | 0.6 | 1 |
| Posterior prob \(P(\cdot \mid D)\) | 0.89 | 0.11 | 1 |
Bayesian Inference for Random Variables
For any random variables parameter \(\theta\) and data \({\bf Y} = (Y_1, \dots, Y_n)\),
\(\pi(\theta)\): the prior pmf/pdf of \(\theta\)
\(L(\theta \mid y_1,\dots, y_n)\): the likelihood of \(\theta\) given observed data \(\mathbf{y}= \{y_i \}_{i = 1}^n\).
The posterior distribution of \(\theta\) given \(\mathbf{y}\) is
\[\pi(\theta \mid \mathbf{y}) = \frac{L(\theta \mid \mathbf{y})\pi(\theta)}{p(\mathbf{y})}\] where \[p(\mathbf{y}) = \begin{cases} \int_{\Theta} L(\theta \mid \mathbf{y})\pi(\theta) ~ d\theta & \text{if } \theta \text{ is continuous }\\ \sum_{\theta \in \Theta} L(\theta \mid \mathbf{y})\pi(\theta) & \text{if } \theta \text{ is discrete } \end{cases}\]
Proportionality
\[\pi(\theta \mid \mathbf{y}) = \frac{L(\theta \mid \mathbf{y})\pi(\theta)}{p(\mathbf{y})} \propto_{\theta} L(\theta \mid \mathbf{y})\pi(\theta)\]
\[\text{posterior } \propto \text{ likelihood } \cdot \text{ prior } \]
Motivation Example
- Michelle has decided to run for governor of Wisconsin.
- According to previous 30 polls,
- Michelle’s support is centered round 45%
- she polled at around 35% in the dreariest days and around 55% in the best days
- With this prior information, we’d like to estimate/update Michelle’s support by conducting a new poll.

Key: Describe prior and data information using probabilistic models.
- The parameter to be estimated is \(\theta\), the Michelle’s support, which is between 0 and 1.
Prior Distribution
- A popular probability distribution for probability is beta distribution, \(\text{beta}(\alpha, \beta)\), where \(\alpha > 0\) and \(\beta > 0\) are shape parameters.
\[\pi(\theta \mid \alpha, \beta) = \frac{\Gamma(\alpha+\beta)}{\Gamma(\alpha)\Gamma(\beta)}\theta^{\alpha - 1}(1-\theta)^{\beta-1}\]
Prior Distribution
\(\theta \sim \text{beta}(\alpha, \beta)\)
In the prior model, \(\alpha\) and \(\beta\) are hyperparameters to be chosen to reflect our prior information.
Michelle’s support is centered round 45%, and she polled at around 35% in the dreariest days and around 55% in the best days.
Choose \(\alpha\) and \(\beta\) so that the prior mean is about 0.45 and the range is from 0.35 to 0.55.
\(\mathrm{E}(\theta) = \frac{\alpha}{\alpha + \beta}\)
\(\mathrm{Var}(\theta) = \frac{\alpha\beta}{(\alpha+\beta)^2(\alpha+\beta+1)}\)
Prior Distribution

Likelihood
You plan to conduct a new poll of \(n = 50\) Cheeseheads and record \(Y\), the number that support Michelle.
What distribution can be used for modeling likelihood connecting the data \(y\) and the parameter we are interested, \(\theta\)?
- If voters answer the poll independently, and the probability that any polled voter supports Michelle is \(\theta\), we could consider
\[Y \mid \theta \sim \text{binomial}(n=50, \theta)\]
- The poll result is \(y = 30\), the likelihood is
\[L(\theta \mid y = 30) = {50 \choose 30}\theta^{30}(1-\theta)^{20}, \quad \theta \in (0, 1)\]
Likelihood

Bayesian Model
\[\begin{align}Y \mid \theta &\sim \text{binomial}(n=50, \theta)\\ \theta &\sim \text{beta}(45, 55) \end{align}\]
Goal: Obtain the posterior distribution \(\pi(\theta \mid y)\).
\[ \begin{align} \pi(\theta \mid y) &\propto_{\theta} L(\theta \mid y)\pi(\theta) \\ &= {50 \choose 30}\theta^{30}(1-\theta)^{20} \times \frac{\Gamma(100)}{\Gamma(45)\Gamma(55)}\theta^{44}(1-\theta)^{54}\\ &\propto_{\theta} \theta^{74}(1-\theta)^{74}\\ &= \frac{\Gamma(150)}{\Gamma(75)\Gamma(75)} \theta^{74}(1-\theta)^{74} \\ &= \text{beta}(75, 75)\end{align} \]
using the fact that \(\int_{\mathcal{X}} f(x) dx = 1\) for any pdf \(f(x)\).
Posterior Distribution

Take-home Message
The parameter is a random variable in the Bayesian world.
It is fixed and constant in the frequentist world.
Bayesian Linear Regression
Normal Data Model
In simple linear regression,
\[Y_i \mid \beta_0, \beta_1, \sigma \stackrel{ind}{\sim} N\left(\mu_i, \sigma^2 \right) \quad \text{with} \quad \mu_i = \beta_0 + \beta_1 X_i\]
This normal data model is our likelihood \(L(\boldsymbol \theta= (\beta_0, \beta_1, \sigma) \mid \mathcal{D} = \{\mathbf{y}, \mathbf{x}\})\), as it evaluates how the data are compatible with different possible values of parameters.
To be a Bayesian, what do we do next?
- Assign priors to the unknown parameters, then do the posterior inference using Bayes’ rule!
- Big question is how?
Prior Models
- There are countless approaches to construct priors for \(\beta_0, \beta_1\), and \(\sigma\).
- For simplicity, assume \(\beta_0, \beta_1\), and \(\sigma\) are independent, \(\pi(\boldsymbol \theta) = \pi(\beta_0, \beta_1, \sigma) = \pi(\beta_0)\pi(\beta_1)\pi(\sigma)\)
- \(\beta_0\) and \(\beta_1\) can technically take any values in the real line.
\[\begin{align} \beta_0 \sim N(m_0, s_0^2) \\ \beta_1 \sim N(m_1, s_1^2) \end{align}\]
- \(\sigma\) must be positive.
\[\begin{align} \sigma \sim \text{Exp}(\lambda) \end{align}\] \(\pi(\sigma) = \lambda e^{-\lambda \sigma}\), \(\lambda > 0\) and \(\mathrm{E}(\sigma) = 1/\lambda\), and \(\mathrm{Var}(\sigma) = 1/\lambda^2\)
Bayesian Simple Linear Regression Model
\[\begin{align} Y_i \mid \beta_0, \beta_1, \sigma &\stackrel{ind}{\sim} N\left(\mu_i, \sigma^2 \right) \quad \text{with} \quad \mu_i = \beta_0 + \beta_1 X_i \\ \beta_0 &\sim N(m_0, s_0^2) \\ \beta_1 &\sim N(m_1, s_1^2) \\ \sigma &\sim \text{Exp}(\lambda) \end{align}\]
Capital Bikeshare bayesrules::bikes Data in Washington, D.C.
Rows: 500
Columns: 2
$ rides     <int> 654, 1229, 1454, 1518, 1362, 891, 1280, 1220, 1137, 1368, 13…
$ temp_feel <dbl> 64.7, 49.0, 51.1, 52.6, 50.8, 46.6, 45.6, 49.2, 46.4, 45.6, …
Tuning Prior Models
-
Prior understanding 1:
- On an average temperature day, say 65 or 70 degrees, there are typically around 5000 riders, though this average could be somewhere between 3000 and 7000.
- The prior information tells us something about \(\beta_0\), but the information has been centered.
- The centered intercept, \(\beta_{0c}\), reflects the typical ridership at the typical temperature.
\(\beta_{0c} \sim N(5000, 1000^2)\)

Tuning Prior Models
-
Prior understanding 2:
- For every one degree increase in temperature, ridership typically increases by 100 rides, though this average increase could be as low as 20 or as high as 180.
\(\beta_{1} \sim N(100, 40^2)\)

Tuning Prior Models
-
Prior understanding 3:
- At any given temperature, daily ridership will tend to vary with a moderate standard deviation of 1250 rides.
\(\sigma \sim \text{Exp}(0.0008)\) because \(\mathrm{E}(\sigma) = 1/\lambda = 1/0.0008 = 1250\)

Prior Model Simulation
- 100 prior plausible model lines \(\mu_{Y|X} = \beta_0 + \beta_1 X\)

Posterior Inference
Update our prior understanding of the relationship between ridership and temperature using data information provided by likelihood.
The joint posterior distribution is
\[\pi(\beta_0, \beta_1, \sigma \mid \mathbf{y}) = \frac{L(\beta_0, \beta_1, \sigma \mid \mathbf{y})\pi(\beta_0, \beta_1, \sigma)}{p(\mathbf{y})}\] where
\(L(\beta_0, \beta_1, \sigma \mid \mathbf{y}) = p(\mathbf{y}\mid \beta_0, \beta_1, \sigma) = \prod_{i=1}^np(y_i \mid \beta_0, \beta_1, \sigma)\)
\(\pi(\beta_0, \beta_1, \sigma) = \pi(\beta_0)\pi(\beta_1)\pi(\sigma)\)
\(p(\mathbf{y}) = \int \int \int \left[\prod_{i=1}^np(y_i \mid \beta_0, \beta_1, \sigma)\right]\pi(\beta_0)\pi(\beta_1)\pi(\sigma) ~ d\beta_0d\beta_1d\sigma\)
There are lots of ways to generate/approximate the posterior distribution of parameters. One method is Markov chain Monte Carlo (MCMC).
rstanarm::stan_glm()
-
rstanarmuses RStan syntax1 to do Bayesian inference for applied regression models (arm).
Generate 4 Monte Carlo chains (
chains = 4), each having 10000 iterations (iter = 5000*2).Each iteration draw a posterior sample of the \(\beta_0\), \(\beta_1\), and \(\sigma\).
After tossing out the first half of Markov chain values from the warm-up or burn-in phase,
stan_glm()simulation produces four parallel chains of length 5000 for each model parameter:
\(\{ \beta_0^{(1)}, \beta_0^{(2)}, \dots, \beta_0^{(5000)} \}\), \(\{ \beta_1^{(1)}, \beta_1^{(2)}, \dots, \beta_1^{(5000)} \}\), \(\{ \sigma^{(1)}, \sigma^{(2)}, \dots, \sigma^{(5000)} \}\)
Convergence Diagnostics

Convergence Diagnostics
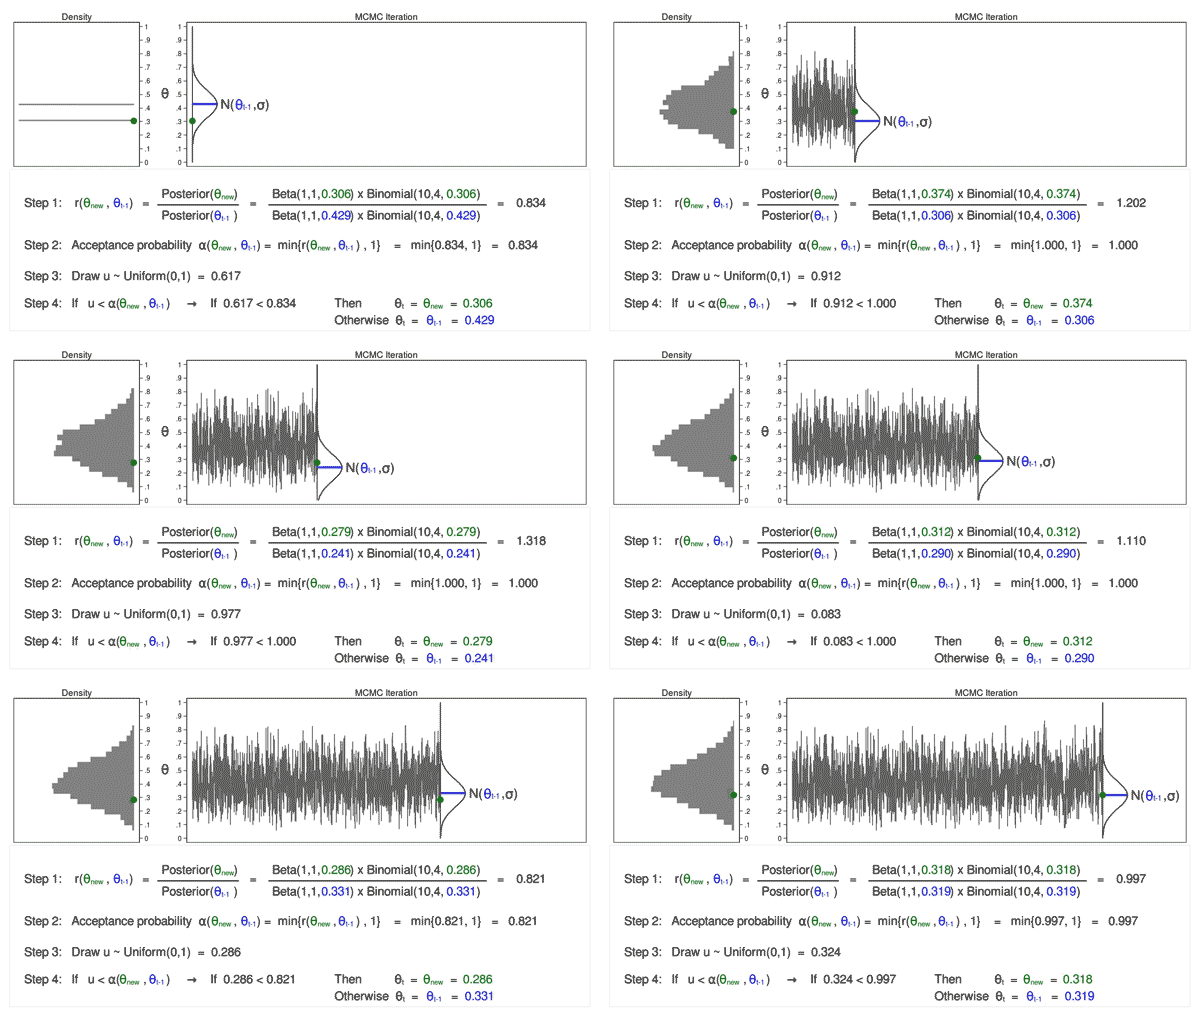
Source: https://blog.stata.com/2016/11/15/introduction-to-bayesian-statistics-part-2-mcmc-and-the-metropolis-hastings-algorithm/
Convergence Diagnostics
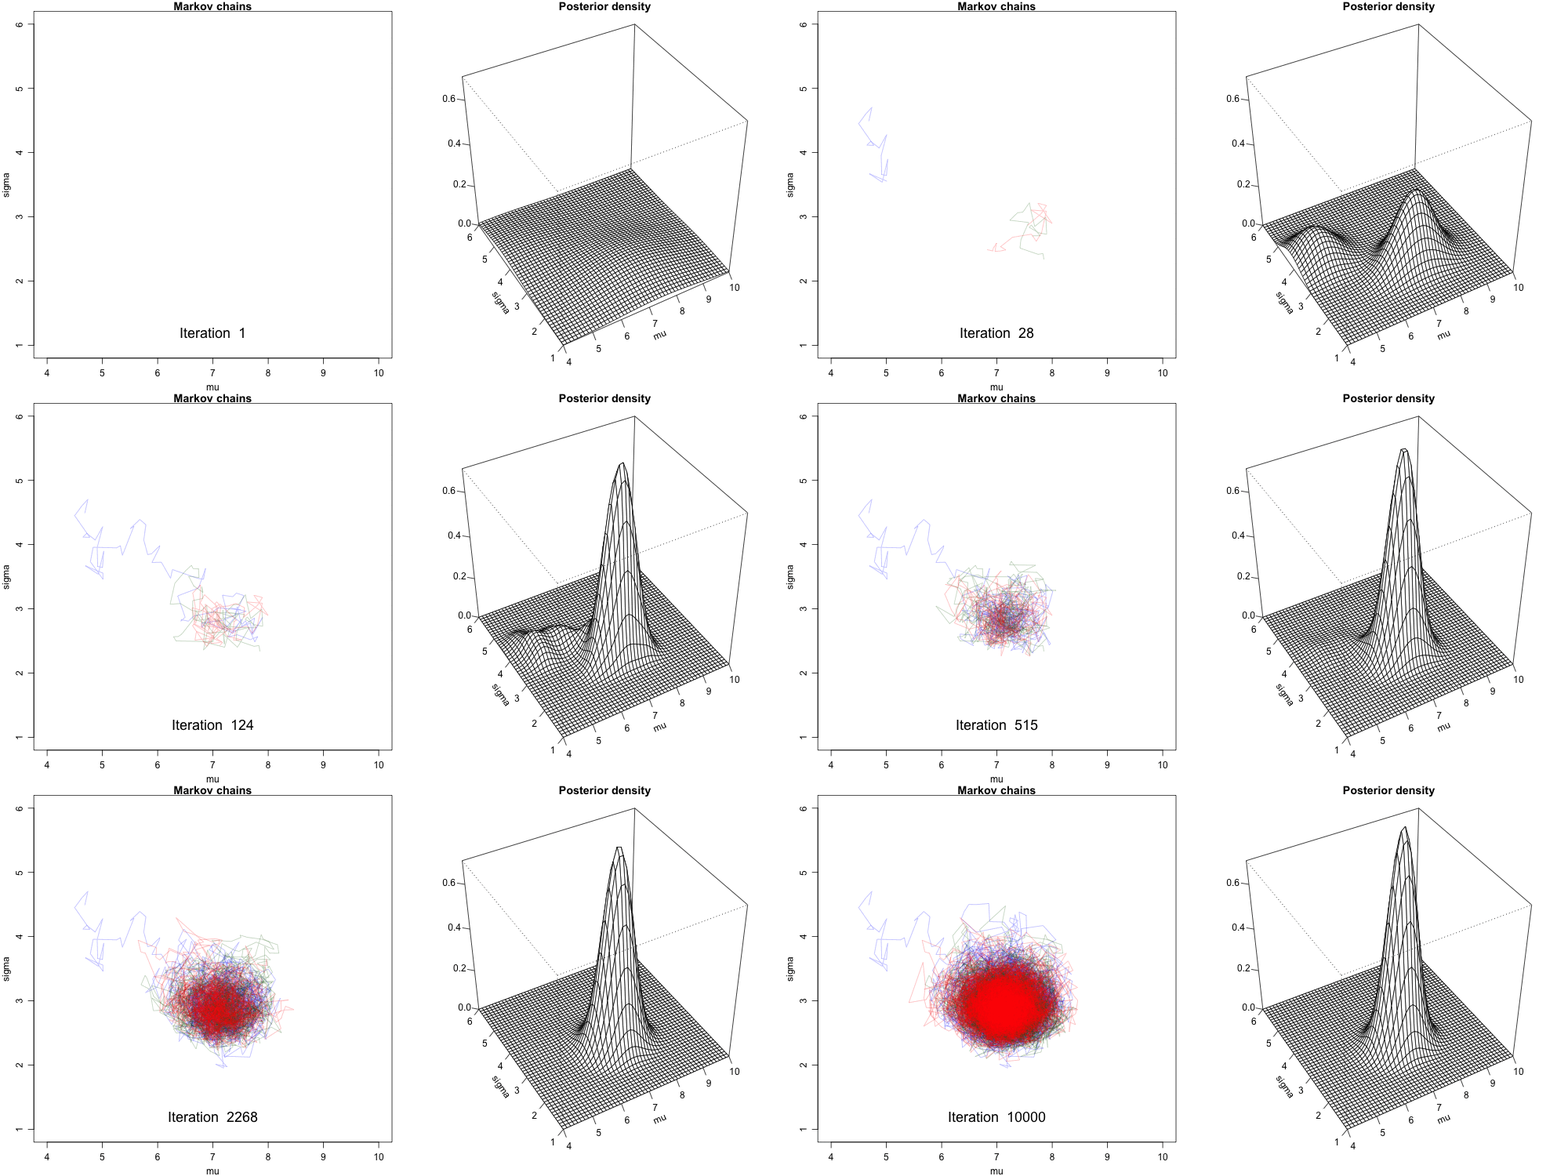
Convergence Diagnostics

Convergence Diagnostics
(Intercept)   temp_feel       sigma
1.01 1.02 1.01 (Intercept) temp_feel sigma
1 1 1 - Both effective sample size and R-hat are close to 1, indicating that the chains are stable, mixing quickly, and behaving much like an independent sample.
Convergence Issues
-
Highly Autocorrelated Chain: Effective size is small, not many independent samples that are representative of the true posterior distribution.
- Run longer and thinning the chain

-
Slow Convergence: Need wait longer to have the chain reached a stable mixing zone that are representative of the true posterior distribution.
- Set a longer burn-in or warm-up period

Interpreting the Posterior
# Posterior summary statistics
tidy(bike_model, effects = c("fixed", "aux"),
     conf.int = TRUE, conf.level = 0.80)
# A tibble: 4 × 5
term estimate std.error conf.low conf.high
<chr> <dbl> <dbl> <dbl> <dbl>
1 (Intercept) -2194. 351. -2648. -1743.
2 temp_feel 82.2 5.04 75.7 88.7
3 sigma 1282. 40.9 1231. 1336.
4 mean_PPD 3487. 81.1 3384. 3592. - The posterior relationship is
\[-2196 + 82.2 X\]
The 80% credible interval for \(\beta_1\) is \((75.7, 88.5)\).
Given the data, the probability that \(\beta_1\) is between 75.7 and 88.5 is 80%., i.e., \(P(\beta_1 \in(75.7, 88.5) \mid \mathbf{y}, \mathbf{x}) = 80\%\).
Posterior Samples
# Store the 4 chains for each parameter in 1 data frame
bike_model_df <- as.data.frame(bike_model)
nrow(bike_model_df)
[1] 20000 (Intercept) temp_feel sigma
1 -2303 83.7 1294
2 -2483 86.5 1332
3 -1998 78.0 1236
4 -2240 81.2 1281
5 -2252 82.3 1309
6 -2272 83.9 1272How to obtain \(P(\beta_1 > 0 \mid \mathbf{y}, \mathbf{x})\)?
Posterior Regression Lines

Posterior Predictive Draws
For each posterior draw \(\{\beta_0^{(t)}, \beta_1^{(t)}, \sigma^{(t)} \}_{t = 1}^{20000}\), we have the posterior predictive distribution \[Y_i^{(t)} \sim N\left(\beta_0^{(t)} + \beta_1^{(t)}X_i, \, (\sigma^{(t)})^2\right)\]

Bayesian Interpretation for Ridge and Lasso
Lasso and Ridge regression can be interpreted as a Bayesian regression model.
The same data-level likelihood \[Y_i \mid \boldsymbol \beta, \sigma \stackrel{ind}{\sim} N\left(\mu_i, \sigma^2 \right) \quad \text{with} \quad \mu_i = \mathbf{x}_i'\boldsymbol \beta\]
We use prior distributions to regularize how parameters behave.
- The two methods can assign the same prior distributions to \(\beta_0\) and \(\sigma\), but they use different priors on \(\{\beta_j\}_{j = 1}^p\).1
Lasso: \(\beta_j \stackrel{iid}{\sim} \text{Laplace}\left(0, \tau(\lambda)\right)\)
Ridge: \(\beta_j \stackrel{iid}{\sim} N\left(0, \tau(\lambda)\right)\)
Ridge and Lasso Priors
Lasso
\[\beta_j \stackrel{iid}{\sim} \text{Laplace}\left(0, \tau(\lambda)\right)\]
Lasso solution is the posterior mode of \(\boldsymbol \beta\)
\[\boldsymbol \beta^{(l)} = \mathop{\mathrm{arg\,max}}_{\boldsymbol \beta} \,\,\, \pi(\boldsymbol \beta\mid \mathbf{y}, \mathbf{x})\]

Ridge
\[\beta_j \stackrel{iid}{\sim} N\left(0, \tau(\lambda)\right)\]
Ridge solution is the posterior mode/mean of \(\boldsymbol \beta\)
\[\boldsymbol \beta^{(r)} = \mathop{\mathrm{arg\,max}}_{\boldsymbol \beta} \,\, \, \pi(\boldsymbol \beta\mid \mathbf{y}, \mathbf{x})\]
